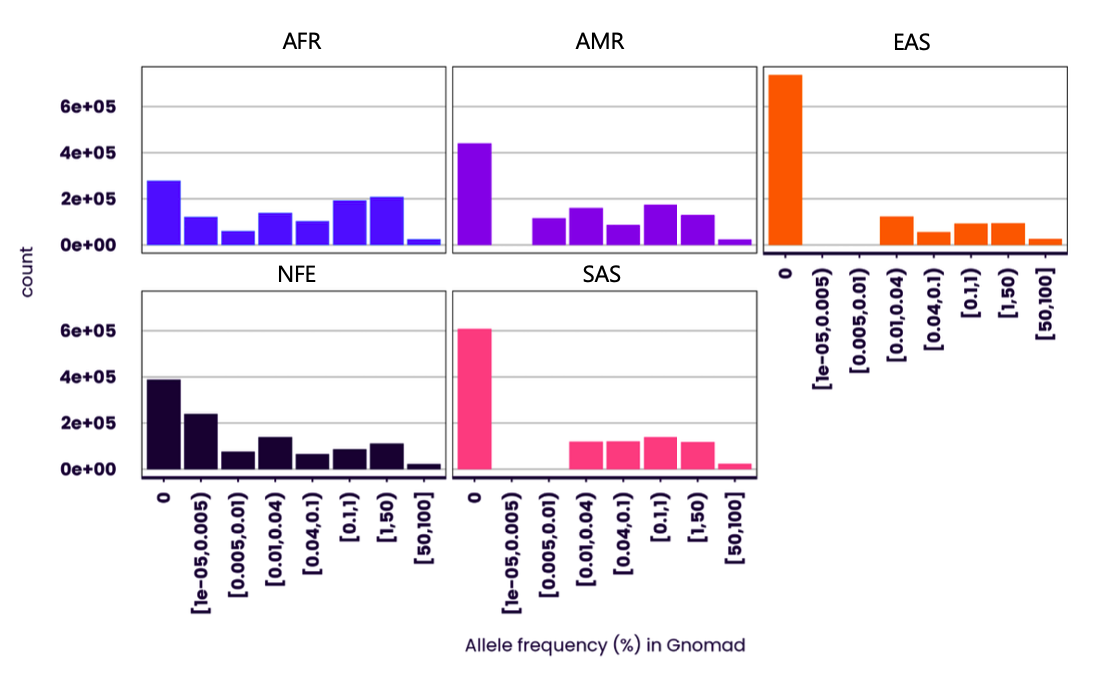
Imputed genetic data
Information about the imputed genotype data in Our Future Health resource. This documentation includes the scope and structure of the data, and the process of imputation.
An overview of the imputation process
What does imputation involve?
Imputation is the process of inferring genotypes for unobserved variants in a dataset. This is performed with a reference panel of samples in which the variants that we wish to impute have been genotyped. Imputing genotypes results in an increased number of variants available in a dataset where individuals have only been genotyped for a subset of variants.
Imputation first requires phasing where the underlying haplotypes of each individual are inferred. A haplotype is a sequence of alleles on the same physical chromosome and can be correlated with other variants in the same region. Phasing identifies which haplotypes are inherited together on the same chromosome strand. For genotype array data, haplotype phases are estimated using linkage disequilibrium (LD) from the reference panel. High accuracy of the phasing process increases the quality of imputation. Once haplotype phases have been inferred, a reference panel of phased haplotypes can then be used to impute non-genotyped or missing variants in each sample.
Imputation and phasing of Our Future Health genotype array data were performed by Genomics Ltd using a reference panel based on the UK Biobank 200k phased whole genome sequenced set. Compared to other reference panels with multiple ancestries, UK Biobank is closer to the UK population sampled by Our Future Health. The sample size of the UK Biobank 200K WGS data is also larger in comparison to other reference panels. These factors contribute to more accurate haplotype phasing of rare variants, and high-quality imputation across diverse ancestries1.
Which data was used for the reference panel?
The UK Biobank whole genome sequencing (WGS) data was used as the reference dataset for phasing and imputation. Specifically, the UK Biobank 200K SHAPEIT-phased data2,3 (Field 20279) was used as it contains both single nucleotide variants (SNVs) and small insertion-deletion (indel) polymorphisms. Although the UK Biobank 200K WGS data has also been phased with Beagle4,5 (Field 20278), the SHAPEIT-phased version contains more variants due to less stringent filtering (684,687,095 variants compared with 458,129,145). Of the initial 200,011 samples within the 200K WGS SHAPEIT release, 184,801 (92.40%) were retained in the reference panel after filtering for withdrawn individuals and samples with up to 3rd degree genetic relatedness.
Global ancestry estimates were available for most samples in the reference panel with proportions for five continental ancestry components: Sub Saharan Africa (AFR_SS), Native American (AMR_NAT), East Asian (EAS), European (EUR) and South Asian (SAS) (Error! Reference source not found.). 95% of UK Biobank reference panel samples were estimated to be of European genetic ancestry.
Table 1 - Number of samples in the panel according to their main genetic ancestry component
Sub Saharan African (AFR_SS)
3,664
1.98%
Native American (AMR_NAT)
176
0.10%
East Asian (EAS)
1,206
0.65%
European (EUR)
175,494
94.96%
South Asian (SAS)
4,053
2.19%
Unknown*
208
0.11%
Total
184,801
*Unknown = global ancestry unclassified
What is the variant composition of the reference panel?
After filtering for the selected samples, variants of the UK Biobank 200K WGS SHAPEIT reference panel data were filtered to exclude singleton variants and capture common variants across all 5 ancestry groups. To boost equity in genetic imputation, we used genetic ancestry specific minor allele count reference panel filters to help retain common variation in ancestry groups with smaller numbers (Table 2).
Table 2 - Allele filtering criteria for variants in the reference panel
Ancestry
AN
Min MAC for min MAF criteria
Min MAF
Actual min MAF (%)
AFR_SS
7,328
1
≥ 0.01%
0.0136
AMR_NAT
352
1
≥ 0.25%
0.2841
EAS
2,412
1
≥ 0.04%
0.0415
EUR
350,988
18
≥ 0.005%
0.0051
SAS
8,106
1
≥ 0.01%
0.0123
AN: total number of alleles in called genotypes, MAC: minor allele count, MAF: minor allele frequency. MAC of 1 does not apply to singleton variants.
After variant filtering, roughly 160M variants across 152M genomic positions were retained (23% of variants in the phased data). 9% of the retained variants are indels and 91% SNVs. 4% of the positions had multiple variants, where multiallelic positions were represented as multiple entries of biallelic variants (Table 3).
Around 8% of the genotyped variants from the Our Future Health custom array C2 manifest are not present in the reference panel due to being too rare or not present in UK Biobank. As a result, these variants are not included in the output from phasing and imputation. Mitochondrial variants, the Y chromosome and the pseudo-autosomal region (PAR) of the X chromosome were also not part of the reference panel and are not included in the imputed dataset. Researchers interested in analysing these variants should refer to the genotype array data where they are still present.
Table 3 - Imputation panel variants by chromosome
chr1
52,537,212
12,110,767
10,978,167
11,536,369
11,123,418
chr2
58,188,557
13,225,275
12,002,595
12,602,435
12,150,990
chr3
48,522,843
10,992,952
9,970,937
10,473,584
10,097,749
chr4
46,685,988
10,621,931
9,622,966
10,118,457
9,749,697
chr5
43,542,323
9,905,904
8,986,548
9,436,553
9,095,892
chr6
40,967,334
9,410,233
8,504,955
8,956,847
8,631,876
chr7
38,212,946
8,890,214
8,064,179
8,459,761
8,145,364
chr8
37,405,051
8,585,942
7,841,598
8,164,569
7,848,783
chr9
28,892,553
6,695,115
6,106,133
6,370,628
6,130,802
chr10
32,003,117
7,490,576
6,806,284
7,128,488
6,865,635
chr11
32,741,450
7,526,155
6,855,592
7,171,310
6,909,993
chr12
31,571,433
7,267,529
6,568,703
6,915,541
6,663,130
chr13
23,355,133
5,345,096
4,825,286
5,092,591
4,911,599
chr14
21,292,178
4,917,446
4,451,490
4,682,285
4,513,011
chr15
19,366,095
4,516,552
4,097,889
4,297,276
4,137,751
chr16
21,442,389
5,101,945
4,686,833
4,832,562
4,626,269
chr17
18,659,531
4,495,054
4,059,738
4,264,426
4,099,311
chr18
18,284,345
4,219,007
3,821,509
4,017,189
3,871,939
chr19
14,083,080
3,539,312
3,191,746
3,343,271
3,200,838
chr20
15,047,218
3,565,378
3,248,184
3,392,619
3,266,884
chr21
8,463,891
2,037,862
1,846,461
1,935,782
1,861,015
chr22
8,622,840
2,143,802
1,953,738
2,035,315
1,954,715
ChrX (nonPAR)
24,799,588
6,983,053
6,372,882
6,675,331
6,451,201
Total
684,687,095
159,587,100
144,864,413
151,903,189
146,307,862
The within-cohort allele frequency filters retained rare and common variation from all five ancestry groups as shown in Figure 1.

How was phasing and imputation performed?
Imputation and phasing were performed using Beagle 5.4 9 (beagle.22Jul22.46e.jar), which has proven to be computationally fast and memory efficient when working with large sample sizes6. The default algorithm parameters were applied. This included 3 burn-in iterations for the initial haplotype frequency model to infer genotype phase, and 12 iterations for the phasing process, performed within a 40 centiMorgan (cM) window with a 2 cM window overlap. The default parameters have been documented (http://faculty.washington.edu/browning/beagle/beagle_5.4_18Mar22.pdf) and genetic maps used are available for download (https://bochet.gcc.biostat.washington.edu/beagle/genetic_maps/).
How was imputation performance assessed?
In silico simulation
Performance of imputation with the resulting reference panel was assessed using UK Biobank WGS data from 2,208 unrelated individuals of diverse global ancestries. These individuals were not included in the 200K WGS imputation panel and were selected from the 500K WGS release. These individuals were not related (to the 3rd degree) with other UK Biobank participants. For the test dataset, 500 samples were randomly selected to include up to 500 samples from each of the 5 continental ancestry groups (Sub Saharan Africa (AFR_SS), Native American (AMR_NAT), East Asian (EAS), European (EUR) and South Asian (SAS)).
Genotypes from chromosome 22 were filtered for manifest positions of the Our Future Health array. Imputation was performed with the 200K WGS reference panel using Beagle 5.4 (version beagle.22Jul22.46e.jar). The original WGS genotypes and imputed genotypes were compared by ancestry group and allele frequencies extracted from Gnomad 4.0.07. Imputation accuracy was estimated as the squared correlation coefficient between the imputed genotype dosages and the WGS genotypes (dosage r2). Imputation accuracy for European samples was greater than 0.9 across all allele frequency bins. For other ancestry groups, this was greater than 0.6 for variants with frequency over 1-5%.
Experimental validation
Imputation performance was also assessed using a subset of samples from the 1000 Genomes Project8 provided by The Coriell Institute (N=1,998) which were genotyped with the Our Future Health array. Genotyped samples were filtered for low call rate, ambiguous genetic sex and sex mismatch. Samples that did not have 30x WGS reference data available were also excluded, leaving 1,750 samples. This included 455 African individuals (AFR), 238 American individuals (AMR), 294 East Asian individuals (EAS), 370 South Asian individuals (SAS), 91 individuals originating from Great Britain (GBR), and 302 individuals of other European ancestry (EUR_nonGBR). After filtering variants for excessive genotype missingness (> 5%) and Hardy-Weinberg P-value < 1x10⁻¹⁰, phasing and imputation were performed with Beagle. Imputation accuracy (dosage r2) was estimated as described above for UK Biobank samples. Imputation performance was assessed for each ancestry, where variants were grouped using Gnomad 4.0.0 allele frequencies. Imputation performance was highest for Coriell GBR samples, which was higher compared with the non-British European samples (Figure 2), and consistent with the imputation accuracy observed for European UK Biobank samples.

How was imputation performed with Our Future Health samples?
Imputation was performed for a subset of Our Future Health samples using genotype data generated with the custom ‘OurFutureHealthv1’ beadchip array assay. Called genotype data received from the genotyping laboratory was assessed on the sample level before being submitted for imputation. Samples were rejected based on the following:
if the call rate calculated using all variants was <97%
if the sample did not have questionnaire responses
if self-reported sex registered at birth was missing, due to not submitting a questionnaire or responding ‘Prefer not to answer’
if self-reported sex registered at birth and genetic sex were discordant (except for participants who reported ‘Intersex’, which was not considered discordant with any genetic sex)
if the targeted gene amplification (TGA) control probe values were outside the manufacturer's recommended range (indicating possible failure of the PCR amplification for pharmacogenomic content)
if on the same plate as the sample, the technical replicate sample pair genotype concordance was <99% and the control sample genotype concordance to whole genome sequence data was <99%
if on the same plate as the sample >4% of samples were discordant in self-reported sex registered at birth and genetic sex, among those which were neither missing self-reported sex registered at birth nor called as ‘Unknown’ genetic sex
if on the same plate as the sample >=90 samples (out of 96) were excluded due to call rate, TGA or sex discordance checks
if the sample was the 1000 Genomes Project control sample
if the sample was one of the pair of technical replicate samples on a plate with the lowest call rate of the two, or was the sample closest to the edge of the plate if call rates were identical
For samples passing these quality checks, genotype array data were securely transferred to the UK Biobank RAP in a secure and private project space in which Genomics Ltd could conduct phasing and imputation according to our agreed protocol. This was performed for samples in groups of multiple batches that had been genotyped on the same date. Each group consisted of 2,000 to 8,000 samples. Batches from more than one genotype date were combined if a group was less than 2,000 samples, which was deemed to be inefficient. Pseudo-anonymisation of the data was performed before sending for imputation. In doing so, sample IDs provided by the genotyping laboratory were replaced with a participant ID (PID) specific for Genomics Ltd. Original genotyping batch IDs were not made available, but samples were given an imputation “group” ID.
Once the genotype data were securely transferred to the UK Biobank RAP secure and private project, Genomics Ltd conducted quality checks for each grouping, where variants were excluded due to genotype missingness > 5% or deviation from Hardy-Weinberg (P-value < 1x10⁻¹⁰). Additional exclusions included multi-allelic variants due to the complexity of genotype calling at multi-allelic loci; in addition to a small number of variants where the REF and ALT alleles were incorrectly called. Excluded variants present on the reference panel were subsequently imputed. Data passing these checks were taken forward for phasing and imputation, performed with the 200K WGS reference panel using Beagle 5.4 (version beagle.22Jul22.46e.jar) for autosomal and non-PAR X chromosome biallelic variants and indels.
How did we process the data for this release?
Upon receipt of the imputed data files from Genomics Ltd, the following checks were performed for each grouping:
all expected data fields were present and their contents had valid data types and ranges
the imputation accuracy (dosage r2) was at least 0.3 for ALT allele frequencies > 1%
the dataset included both imputed and phased genotypes
genotyped variants where the REF and ALT alleles were incorrectly called (mismapped) had been excluded unless present due to imputation
multi-allelic variants (represented as multiple entries of biallelic variants) had been excluded unless present due to imputation.
Imputed data were received for 147 groups of ~750,00 samples as .VCF.gz files for each chromosome. The mean dosage r2 was estimated across all chromosomes for each group. These were used to assess the imputation quality across all groups and identify any outliers. In doing so, imputation quality was found to be stable across all groups with little variation (Figure 3).

Imputed genotype data across the groups were split into 200 kilobase regions and then merged using the merge command in bcftools (version 1.20). For the samples selected for release, the dosage r2 and minor allele frequencies were re-estimated from genotype probabilities using Beagle utilities as previously described by Browning and Browning 9. The minor and major alleles were subsequently flipped where necessary to ensure consistency with GRCh38 reference sequence, such that allele frequencies relate to the ALT allele.
What is the imputation quality of rare variants?
The distribution of dosage r2 was assessed for variants stratified by their ALT allele frequency to assess common, low frequency, and rare variants as shown in the plots below (Figure 4). Strong imputation performance was found even with the most rare variants (0.01% <= ALT allele frequency < 0.1%).

What ethnicities are represented in the imputed dataset?
89.3% of samples (491,280) in this release are self-reported white British or other white background while 7.7% (42,144) are of self-reported non-white ethnicity (Table 1).
Table 1 - Self-reported ethnicities of participants in the imputed dataset
White European
491,280
89.3%
Non-European
42,144
7.70%
Mixed (White European and Non-European)
6,483
1.20%
Mixed other
3,042
0.60%
Other
5,791
1.10%
Prefer not to answer
970
0.20%
Missing
290
0.10%
Total
550,000
100.00%
References
1. Shi S, Rubinacci S, Hu S, Moutsianas L, Stuckey A, Need AC, Palamara PF, Caulfield M, Marchini J, Myers S. A. (2024). Genomics England haplotype reference panel and imputation of UK Biobank. Nat Genet,56(9),1800-1803. https://doi.org/10.1038/s41588-024-01868-7
2. Halldorsson, B. v., Eggertsson, H. P., Moore, K. H. S., Hauswedell, H., Eiriksson, O., Ulfarsson, M. O., Palsson, G., Hardarson, M. T., Oddsson, A., Jensson, B. O., Kristmundsdottir, S., Sigurpalsdottir, B. D., Stefansson, O. A., Beyter, D., Holley, G., Tragante, V., Gylfason, A., Olason, P. I., Zink, F., … Stefansson, K. (2022). The sequences of 150,119 genomes in the UK Biobank. Nature, 607(7920), 732–740. https://doi.org/10.1038/s41586-022-04965-x
3. Delaneau, O., Coulonges, C., & Zagury, J. F. (2008). Shape-IT: New rapid and accurate algorithm for haplotype inference. BMC Bioinformatics, 9(1), 1–14. https://doi.org/10.1186/1471-2105-9-540
4. Browning, B. L., Tian, X., Zhou, Y., & Browning, S. R. (2021). Fast two-stage phasing of large-scale sequence data. The American Journal of Human Genetics, 108(10), 1880–1890. https://doi.org/10.1016/j.ajhg.2021.08.005
5. Browning, B. L., Zhou, Y., & Browning, S. R. (2018). A One-Penny Imputed Genome from Next-Generation Reference Panels. The American Journal of Human Genetics, 103(3), 338–348. https://doi.org/10.1016/j.ajhg.2018.07.015
6. de Marino, A., Mahmoud, A. A., Bose, M., Bircan, K. O., Terpolovsky, A., Bamunusinghe, V., Bohn, S., Khan, U., Novković, B., & Yazdi, P. G. (2022). A comparative analysis of current phasing and imputation software. PLOS ONE, 17(10), e0260177. https://doi.org/10.1371/journal.pone.0260177
7. Chen, S., Francioli, L. C., Goodrich, J. K., Collins, R. L., Kanai, M., Wang, Q., Alföldi, J., Watts, N. A., Vittal, C., Gauthier, L. D., Poterba, T., Wilson, M. W., Tarasova, Y., Phu, W., Grant, R., Yohannes, M. T., Koenig, Z., Farjoun, Y., Banks, E., … Karczewski, K. J. (2024). A genomic mutational constraint map using variation in 76,156 human genomes. Nature, 625(7993), 92–100. https://doi.org/10.1038/s41586-023-06045-0
8. Byrska-Bishop, M., Evani, U. S., Zhao, X., Basile, A. O., Abel, H. J., Regier, A. A., Corvelo, A., Clarke, W. E., Musunuri, R., Nagulapalli, K., Fairley, S., Runnels, A., Winterkorn, L., Lowy, E., Paul Flicek, Germer, S., Brand, H., Hall, I. M., Talkowski, M. E., … Xiao, C. (2022). High-coverage whole-genome sequencing of the expanded 1000 Genomes Project cohort including 602 trios. Cell, 185(18), 3426-3440.e19. https://doi.org/10.1016/j.cell.2022.08.004
9. Browning BL, Browning SR. A unified approach to genotype imputation and haplotype-phase inference for large data sets of trios and unrelated individuals. (2009). Am J Hum Genet, 84(2),210-23. https://doi.org/10.1016/j.ajhg.2009.01.005
Last updated
